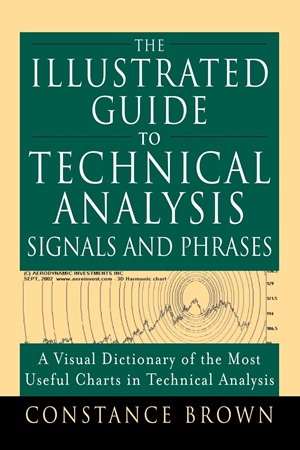
The Illustrated Guide to Technical Analysis Signals and Phrases
19.05 $
- Author: Constance Brown
- Skill Level: Beginner to Advanced
- Format: PDF
- Pages: 305
- Delivery: Instant Download
The Illustrated Guide to Technical Analysis Signals and Phrases by Constance Brown is a unique visual dictionary that transforms complex market patterns into clear, accessible illustrations. Unlike traditional trading books filled with dense text, this guide is a chart-based reference designed for both beginners seeking clarity and experienced professionals looking to refine their technical skills.
Brown, one of the most respected voices in technical analysis, presents over 275 chart examples that visually define the most important signals, patterns, and indicators used in modern trading. From simple formations like double tops, head-and-shoulders, and triangles to advanced concepts such as Gann angles, Fibonacci confluence zones, Elliott wave patterns, and the TED spread, the book offers traders a comprehensive library of chart setups.
The introduction emphasizes the need for simplicity in today’s fast-moving markets, where traders are bombarded with information overload. By stripping away unnecessary noise, Brown helps readers focus on price structure, momentum shifts, and market psychology. Each chart is presented as a standalone lesson—allowing traders to quickly recognize the difference between strong and weak signals, evaluate indicator reliability, and see how technical methods have worked in real-world market conditions.
More than just a reference, this guide also serves as a visual training tool, strengthening a trader’s ability to spot patterns at a glance. It bridges the gap between theory and practice, giving readers a quick-access resource they can use alongside their trading platforms.
This book is both a visual encyclopedia of technical signals and a practical handbook for mastering the art of chart reading. It belongs on the desk of anyone serious about trading stocks, forex, futures, or commodities.
✅ What You’ll Learn:
- The difference between strong, weak, and false divergence signals.
- How to interpret candlestick, bar, point-and-figure, Renko, Kagi, and Gann swing charts.
- Key continuation and reversal patterns including flags, pennants, triangles, double tops, triple bottoms, and wedges.
- Advanced applications of Elliott Wave analysis, including impulsive and corrective wave patterns.
- How to apply Fibonacci retracements, extensions, spirals, and confluence zones to improve timing and target setting.
- The use of oscillators (RSI, MACD, Stochastics, Ultimate Oscillator) and how to evaluate their signals comparatively.
- Techniques for analyzing volatility (VIX, Bollinger Bands, Keltner Channels, Starc Bands) and managing market risk.
- Practical insights into intermarket and intramarket comparisons, sentiment analysis, and global indices.
💡 Key Benefits:
- A visual dictionary of over 275 charts for instant pattern recognition.
- Bridges the gap between theory and practice in technical analysis.
- Helps traders identify high-probability trade setups at a glance.
- Clarifies complex concepts like Gann, Elliott Wave, and Fibonacci through visual examples.
- Ideal as a quick reference guide for both novices and professionals.
- Strengthens pattern recognition skills critical for real-time trading decisions.
👤 Who This Book Is For:
- Beginner traders who struggle with text-heavy explanations and want visual clarity.
- Intermediate and advanced analysts seeking a quick-reference library of technical setups.
- Day traders, swing traders, and portfolio managers who rely on chart-based decision-making.
- Students preparing for technical analysis certifications such as the CMT exam.
- Professionals interested in advanced methods like Gann analysis, Elliott Waves, and intermarket studies.
📚 Table of Contents:
- Technical Analysis Charts
- Chart Index
- Bearish Divergence Signals
- Bullish Divergence Signals
- Chart Scales and Styles (Bar, Candlestick, Gann Swing, Kagi, Point-and-Figure, Line, Percentage Swing)
- Cycles (Fibonacci, Gann Aspects, Harmonic Series, Historic Comparisons)
- Directional Signals (RSI reversals, gaps, key reversals, island reversals, exhaustion gaps, etc.)
- Elliott Wave Applications and Patterns (13 key wave formations)
- Entry Signals (Fibonacci confluence, head-and-shoulders, stochastics, support/resistance tests, breakouts)
- Exit Signals (Trailing Stops)
- Fibonacci Techniques (retracements, extensions, spirals, confluence zones, speed lines)
- Gann and Market Geometry (angles, squares, harmonic wheels, time & price analysis)
- Gaps and Market History (CDs, Treasuries, mortgages, inflation, crashes)
- Ichimoku Kinko Hyo
- Intermarket & Intramarket Comparisons
- Sentiment and Volatility (VIX, TED spread, sentiment gauges)
- Volume Analysis (OBV, volume rate of change, confirmations)
- Yield Curves and Global Comparisons
| Author(s) | Constance Brown |
|---|---|
| Pages | 305 |
| Format | |
| Published Date | 2005 |