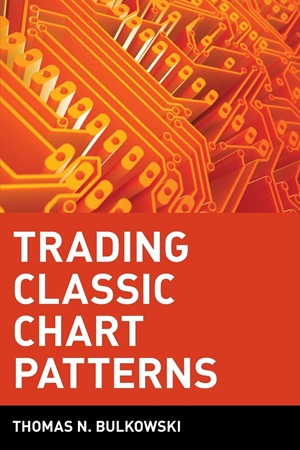
Trading Classic Chart Patterns
20.57 $
- Author: Thomas N. Bulkowski
- Skill Level: Intermediate to Advanced
- Format: PDF eBook
- Pages: 451
- Delivery: Instant download after purchase
Category: Technical Analysis
Tag: Intermediate to Advanced
“Trading Classic Chart Patterns” by Thomas N. Bulkowski is the ultimate technical analysis reference for traders seeking to master price patterns based on empirical data and historical testing. This book is not just a catalog of chart shapes — it’s a statistical guidebook that ranks each pattern based on performance, failure rate, breakout behavior, and profit potential.
Bulkowski studied thousands of trades and chart formations to deliver a work that is both analytical and practical. From beginner-friendly descriptions to advanced performance metrics, this guide explains:
- How to identify reliable patterns like head-and-shoulders, triangles, double tops/bottoms, flags, wedges, and more
- What confirmation rules, breakout volumes, and retracements signal real opportunity
- Which patterns are most profitable — with precise stats on average gains, throwbacks, false breakouts, and risk
- How to set entries, stops, and targets based on pattern structures
- Trading psychology and how patterns reflect crowd behavior
It’s an encyclopedia and trading manual in one, trusted by professionals, swing traders, and chart technicians worldwide.
✅ What You’ll Learn:
- How to visually identify dozens of classic chart patterns in real time
- Pattern performance metrics: frequency, failure rate, and average return
- Which chart patterns work best in bull vs. bear markets
- Entry and exit rules tailored to each specific pattern
- Understanding throwbacks, pullbacks, and failed patterns
- How to combine pattern analysis with volume, trendlines, and other tools
💡 Key Benefits:
- Based on decades of statistical testing and trade data
- Includes over 300 charts and illustrations for visual clarity
- Gives you an edge in timing, target setting, and stop placement
- Explains patterns through the lens of trader behavior and market logic
- Ideal for developing pattern recognition skills and avoiding false signals
👤 Who This Book Is For:
- Intermediate to advanced traders using technical analysis
- Swing traders, position traders, and active investors
- Analysts focused on chart behavior, price patterns, and market psychology
- Students preparing for CMT, CFA, or technical analysis certification
- Traders who want a quantitative, data-backed approach to chart setups
📚 Table of Contents:
- Introduction to Chart Patterns
- Chart Pattern Basics and Setup Guidelines
- Chart Pattern Performance Statistics
- Head-and-Shoulders and Inverted Variants
- Double Tops and Bottoms
- Triangles: Ascending, Descending, Symmetrical
- Flags, Pennants, and Rectangles
- Gaps, Breakouts, and Throwbacks
- Pattern Failures and Avoiding Traps
- Trading Tactics and Risk Management
- Case Studies and Visual Pattern Examples
- Final Pattern Performance Rankings
| Author(s) | Thomas N. Bulkowski |
|---|---|
| Format | |
| Pages | 451 |
| Published Date | 2002 |
