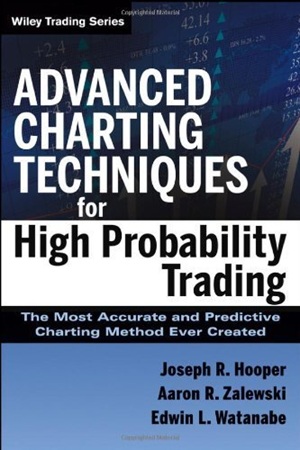
Advanced Charting Techniques for High Probability Trading: The Most Accurate And Predictive Charting Method Ever Created
20.55 $
- Author: Aaron R. Zalewski, Edwin L. Watanabe & Joseph Hooper
- Skill Level: Intermediate to Advanced
- Format: PDF
- Pages: 169
- Delivery: Instant Download
Advanced Charting Techniques for High Probability Trading is a practical, results-driven guide for traders who want to sharpen their chart reading skills and apply them to achieve consistent success in the markets. Written by Aaron R. Zalewski, Edwin L. Watanabe, and Joseph Hooper, this book focuses on the powerful intersection of technical analysis, price action, and advanced charting tools to identify high-probability trade setups.
The authors present a systematic approach to reading charts in real time, teaching how to spot reliable trend directions, breakout opportunities, and support/resistance levels with precision. The book emphasizes the use of moving averages (M1, M2, M3, M4, M5), Bollinger Bands, PSAR, channels, and custom indicators—all designed to help traders pinpoint entries and exits with clarity.
Practical strategies such as the Tethered Slingshot (TSS), Sweet Spot Indicators, and the Trading the Moment (TTM) day-trade setup are explained step by step, with chart examples to illustrate each method. The book also covers the psychology of chart interpretation, helping traders avoid false signals and manage risk with trailing stops and indicator confirmations.
This guide is not a theoretical overview—it is a hands-on trading manual that bridges the gap between technical concepts and actionable strategies. Whether you are trading stocks, ETFs, or options, the methods outlined provide a clear framework for improving timing, accuracy, and profitability.
✅ What You’ll Learn:
- The role of advanced charting techniques in building a trading edge.
- How to identify trend phases, cycles, and parallel channels.
- Practical use of moving average crossovers (M1–M5) for trade timing.
- How to trade with Bollinger Bands, PSAR, and channel indicators.
- Understanding zones and target lines for price forecasting.
- Applying lower chart indicators (L1–L4) for confirmation.
- High-probability setups like TSS (Tethered Slingshot) and TTM (Trading the Moment).
- Risk management with trailing stops and validation techniques.
💡 Key Benefits:
- Learn a complete chart-based trading system from experienced professionals.
- Develop the ability to read charts in real time with confidence.
- Master entry, exit, and risk control techniques for consistency.
- Gain insights into institutional-style chart analysis for retail trading success.
- Adapt strategies across stocks, options, ETFs, and futures markets.
👤 Who This Book Is For:
- Intermediate to Advanced traders looking to refine their technical analysis.
- Swing traders and day traders seeking structured, high-probability setups.
- Investors who want to incorporate charting and indicators into decision-making.
📚 Table of Contents:
Chapter 1 – Introduction to Advanced Charting
- Why Use Charting?
- Advanced Charting Techniques
- Advanced Charting Features
- Validating the V
- Advanced Charting Upper and Lower Indicators
Chapter 2 – Straight-Line Chart
-
Straight-Line Charting / Parallel Channels
Chapter 3 – Direction of a Trend
- Four Phases of a Cycle
- Upward Cycles
- Downward Cycles
- Moving Averages Defined
- Moving Average 1: Lead MA1 (White) M1
- Chart Examples: DY, FSS, AA, AMAT
- Moving Average 2: M2 (Green)
- Moving Average 3: M3 (Blue)
Chapter 4 – Moving Average Crossovers
- M1 Crossing M2 and M3
- 12 Key Points of M1, M2, and M3 Crossovers
- Supplementary Moving Averages (M4, M5)
Chapter 5 – Bollinger Bands, PSAR, Channels, Zones, and FTL
- PSAR
- Channel Indicators (C1, C2, C3)
- Zones
- Upper & Lower Bollinger Bands
- Friday Target Line
Chapter 6 – Putting It All Together: MAs and the BBs
Chapter 7 – Lower Chart Indicators L1 through L4
- Defining Lower Chart Indicators
- L1, L2, L3, L4 setups
Chapter 8 – Special Trade Setups
- The 10-Cent Rule
- Tethered Slingshot (TSS)
- Sweet Spot Indicators
- Trading the Moment (TTM)
- Surrogate Stock Replacement (SSR)
Chapter 9 – Charting Applications and Trade Management
- Trailing Stops
- Identifying False V Patterns
- Risk and Reward Tactics
Chapter 10 – Case Studies and Applications
| Author(s) | Aaron R. Zalewski, Edwin L. Watanabe, Joseph Hooper |
|---|---|
| Format | |
| Pages | 169 |
| Published Date | 2013 |
