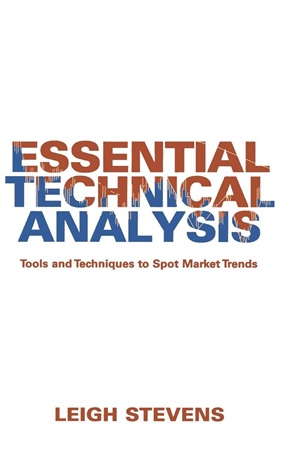
Essential Technical Analysis: Tools and Techniques to Spot Market Trends
11.87 $
- Author: Leigh Stevens
- Skill Level: Intermediate to Advanced
- Format: PDF
- Pages: 399
- Delivery: Instant Download
A Complete, Professional-Grade Guide to Spotting Trends, Patterns, and Profitable Trade Setups
In Essential Technical Analysis, veteran trader and respected market analyst Leigh Stevens delivers a robust and comprehensive guide to understanding market behavior through the lens of technical analysis. This book is ideal for traders seeking to master the core tools and visual techniques used to identify, confirm, and time price trends across any market.
Stevens goes far beyond chart patterns—he presents a complete framework for interpreting support and resistance, applying momentum indicators, working with moving averages, understanding trendlines, Fibonacci retracements, and even integrating trader psychology. Whether you’re developing a discretionary strategy or building rules-based systems, this book gives you the technical foundation you need.
Written with clarity and depth, Essential Technical Analysis stands as a go-to reference for any serious trader or investor who wants to level up their charting skills and market logic.
✅ What You’ll Learn:
- Core principles of trend identification and analysis
- How to use support/resistance, breakouts, and chart patterns effectively
- Application of momentum, volume, and volatility indicators
- Constructing and trading with moving averages
- Fibonacci tools, candlestick analysis, and price projection
- How market psychology influences chart behavior and patterns
💡 Key Benefits:
- Build a solid technical analysis foundation from a seasoned expert
- Master both classic and modern charting techniques
- Learn how to time entries and exits with higher accuracy
- Apply visual and statistical tools to improve trade confirmation
- Use this book as a long-term technical trading reference manual
👤 Who This Book Is For:
- Intermediate to advanced traders and analysts
- Technical traders who want to refine their charting skills
- Swing, position, and intraday traders in any asset class
- Investors developing strategies that blend discretion with logic
- Anyone serious about mastering trend analysis and visual market tools
📚 Table of Contents:
- Why Technical Analysis Works
- Trends, Trendlines, and Channels
- Support, Resistance, and Price Targets
- Chart Patterns: Triangles, Flags, Wedges, Head & Shoulders
- Momentum and Oscillator Indicators
- Volume and Volatility Insights
- Candlesticks and Market Psychology
- Moving Averages and Filters
- Fibonacci Retracement and Projection
- Pulling It All Together: Practical Applications
| Author(s) | Leigh Stevens |
|---|---|
| Format | |
| Pages | 399 |
| Published Date | 2002 |
