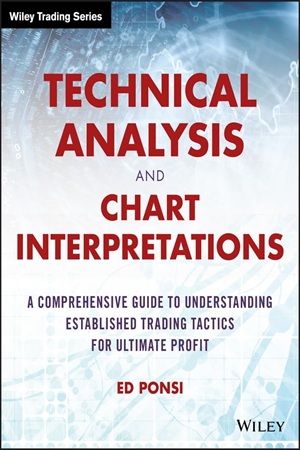
Technical Analysis and Chart Interpretations: A Comprehensive Guide to Understanding Established Trading Tactics for Ultimate Profit
24.41 $
- Author: Ed Ponsi
- Skill Level: Beginner to Intermediate
- Format: PDF, EPUB
- Pages: 383
- Delivery: Instant Download
Technical Analysis and Chart Interpretations by Ed Ponsi is a complete roadmap to mastering the art and science of price behavior. Written in an approachable yet deeply insightful style, this book takes you far beyond textbook definitions and into the real-world application of trading strategies.
Ed Ponsi, a globally respected trader, educator, and bestselling author, breaks down the often intimidating world of technical analysis into clear, actionable steps. From foundational concepts like Dow Theory and market psychology to advanced applications of candlestick patterns, Fibonacci techniques, oscillators, and sentiment analysis, this guide is designed to equip traders at all levels with practical skills they can apply immediately.
One of the standout strengths of this book is its emphasis on price as the ultimate truth. Ponsi demonstrates how charts reveal the emotions and psychology of the market crowd, enabling you to identify high-probability trading opportunities. By combining classical chart patterns, modern indicators, and behavioral insights, readers learn how to balance art and science in their trading decisions.
Unlike many overly complex technical analysis resources, Ponsi’s writing is clear, direct, and grounded in years of market experience. He not only explains what to look for on a chart but also teaches you how to think like a trader—reacting to what the market is telling you rather than predicting blindly.
Whether you’re a beginner seeking clarity or an experienced trader refining your edge, this book provides the tools, tactics, and mental framework needed to navigate today’s fast-moving financial markets with confidence. It’s a timeless addition to any trader’s library and a must-have for those serious about long-term success in trading.
✅ What You’ll Learn:
- Core principles of technical analysis and how to apply them.
- How to interpret different chart types: line, bar, candlestick, and point & figure.
- Identification of support and resistance zones and their role in trading.
- Mastering trend analysis and drawing reliable trendlines and channels.
- Using volume analysis for confirmation of price action.
- Understanding and trading gaps (breakaway, runaway, exhaustion, island reversals).
- How to recognize and trade reversal and continuation patterns.
- Practical application of candlestick patterns for entries and exits.
- Fibonacci trading techniques including retracements, extensions, and time cycles.
- How to apply oscillators, ATR, ADX, and Parabolic SAR in trading strategies.
- Insights into market cycles, sentiment, bubbles, and trader psychology.
💡 Key Benefits:
- A complete step-by-step blueprint for mastering chart reading.
- Bridges the gap between classic charting, indicators, and modern price action.
- Helps traders understand why markets move, not just how.
- Practical lessons from a professional trader with decades of experience.
- Builds both technical skills and psychological discipline.
- Suitable for multiple asset classes: stocks, forex, futures, and commodities.
👤 Who This Book Is For:
This book is ideal for:
- Beginners who want a clear and structured path into technical analysis.
- Intermediate traders aiming to strengthen their understanding of chart patterns, volume, and indicators.
- Active day traders, swing traders, and investors seeking practical, time-tested techniques to improve consistency.
📚 Table of Contents:
Part I – The Foundation of Technical Analysis
- 1.Why Technical Analysis?
- 2.The Language of Trading
- 3.The Cornerstone
- 4.The Dow Theory
Part II – Key Concepts of Technical Analysis
- 5. Common Types of Charts
- 6. Support and Resistance
- 7. Trends and Trend Lines
- 8. Volume
- 9. Gaps
Part III – Price Patterns
- 10. Reversal Chart Patterns
- 11. Continuation Patterns
- 12. Additional Chart Patterns
Part IV – Candlestick Patterns
- 13. Candlestick Charting Patterns
- 14. Continuation and Indecision Candlestick Patterns
Part V – Fibonacci
- 15. Fibonacci Trading Techniques
Part VI – Technical Indicators
- 16. Moving Averages
- 17. Moving Average Envelopes and Bollinger Bands
- 18. Oscillators
- 19. Average True Range (ATR)
- 20. Complex Indicators
Part VII – Oscillators
- 21. Point and Figure Charting
Part VIII – ATR, ADX, and PSAR
- 22. Cycles and Tendencies
Part IX – Cycles
- 23. Sentiment Indicators
Part X – Point and Figure Charting
- 24. Psychological Aspects of Technical Analysis
- 25. Understanding Bubbles
- 26. Trading versus Reality
Part XI – Odds and Ends
- 27. Unconventional Patterns
- 28. Combining Technical and Fundamental Analysis
Part XII – Behavioral Aspects of Technical Analysis
- 29. Final Thoughts on Technical Analysis
| Author(s) | Ed Ponsi |
|---|---|
| Format | PDF, EPUB |
| Pages | 383 |
| Published Date | 2016 |
