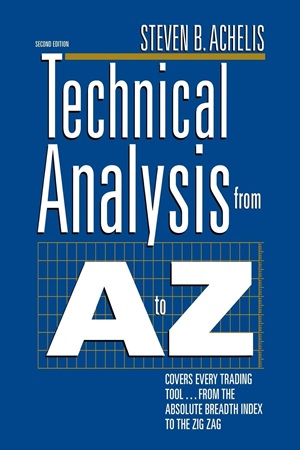
Technical Analysis from A to Z
15.49 $
- Author: Steven B. Achelis
- Skill Level: Beginner to Intermediate
- Format: PDF, EPUB
- Pages: 231 pages
- Delivery: Instant download
Technical Analysis from A to Z by Steven B. Achelis is the ultimate desk reference for traders and investors seeking a clear, concise, and comprehensive guide to the world of technical analysis. Covering over 100 indicators, tools, and charting methods, this book is structured like an encyclopedia—making it one of the most practical and accessible technical guides ever published.
Achelis, founder of MetaStock, delivers not just definitions, but practical application, interpretation tips, and trading signals for each tool. From the Moving Average Convergence Divergence (MACD) to Fibonacci Retracements, from Bollinger Bands to Volume Oscillators, everything is explained with clarity and supported by illustrative charts.
Whether you’re a beginner looking to understand the basics or a veteran trader brushing up on rarely used indicators, this book will quickly become your go-to reference on technical tools and strategy development.
✅ What You’ll Learn:
- Definitions, calculations, and trading interpretations of 100+ technical indicators
- How to apply each indicator in trending, sideways, or volatile markets
- Charting techniques like bar, candlestick, point & figure, and others
- Volume-based indicators and how to read price-volume interaction
- How to select the right indicators for your trading style and timeframe
- Differences between leading vs. lagging indicators, and how to combine them effectively
💡 Key Benefits:
- Master technical analysis without needing complex math or programming
- Build your trading toolbox with proven indicators and techniques
- Gain confidence in using technical signals for entry and exit decisions
- Improve strategy design by understanding how each tool behaves
- Use the book as a quick reference during real-time market analysis
👤 Who This Book Is For:
- Beginner to intermediate traders wanting a solid foundation in technical analysis
- Technical traders looking for a comprehensive reference manual
- Analysts and strategists seeking quick reminders of indicator functions
- Traders building or refining their own rule-based trading systems
- Students of trading and finance studying chart-based market behavior
📚 Table of Contents:
- Introduction to Technical Analysis
- Chart Construction and Patterns
- Overview of Indicator Types: Trend, Momentum, Volume, Volatility
- Detailed A-Z Guide of Indicators (ADX, Bollinger Bands, MACD, RSI, etc.)
- Interpretation Techniques and Signal Triggers
- Practical Tips for Indicator Selection and System Design
- Combining Indicators for Confirmation and Filtering
- Appendix: Indicator Formulas and Parameters
| Author(s) | Steven Achelis |
|---|---|
| Format | PDF, EPUB |
| Pages | 231 |
| Published Date | 1995 |
